

Note
Go to the end to download the full example code.
GFA parameter recovery benchmarks#
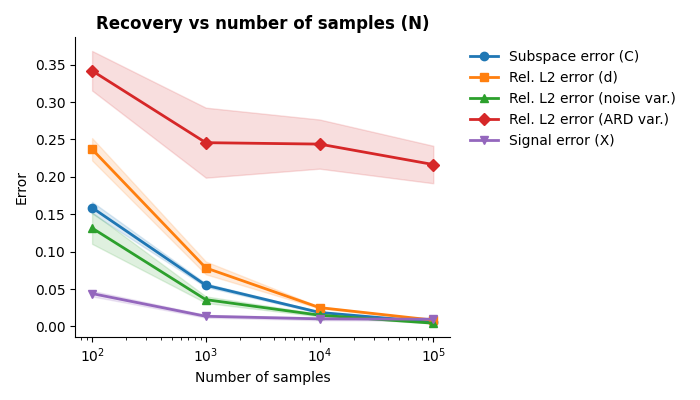
These benchmarks measure how well the fitted model recovers ground truth parameters across varying conditions.
Each sweep varies one factor while holding others at sensible defaults:
n_samples = 1000, y_dim = 30/group, x_dim = 3, n_groups = 2, snr = 1.0
Results show mean ± SEM across 10 independent runs per configuration.
Five metrics are reported:
Subspace error (C) — loading subspace recovery
Rel. L2 error (d) — observation mean recovery
Rel. L2 error (noise var.) — noise variance recovery
Rel. L2 error (ARD var.) — automatic relevance determination (ARD) variance recovery
Signal error (1 - R²) — a proxy for latent recovery
Imports and setup#
from pathlib import Path

import matplotlib.pyplot as plt
import pandas as pd

from benchmarks.plotting import plot_recovery_sweep

# Paths to pre-computed benchmark data
DATA_DIR = Path("../data")
GFA_RECOVERY_DIR = DATA_DIR / "gfa/recovery"


def load_recovery_sweep(name: str) -> pd.DataFrame:
    """Load a recovery sweep CSV."""
    return pd.read_csv(GFA_RECOVERY_DIR / f"{name}.csv")
Recovery vs number of samples#
More samples provide more evidence for parameter estimation. All metrics should improve (errors decrease) as sample count grows.
ARD variance error plateaus despite increasing N. Each ARD parameter is informed by the D loading entries in its column (per group), not by N samples. Once the loadings are well-estimated, the addition of more samples provides diminishing returns for estimating ARD parameters.
df_n_samples = load_recovery_sweep("n_samples")
plot_recovery_sweep(
    df_n_samples,
    title="Recovery vs number of samples (N)",
    xlabel="Number of samples",
)
plt.show()
Recovery vs observed dimensionality#
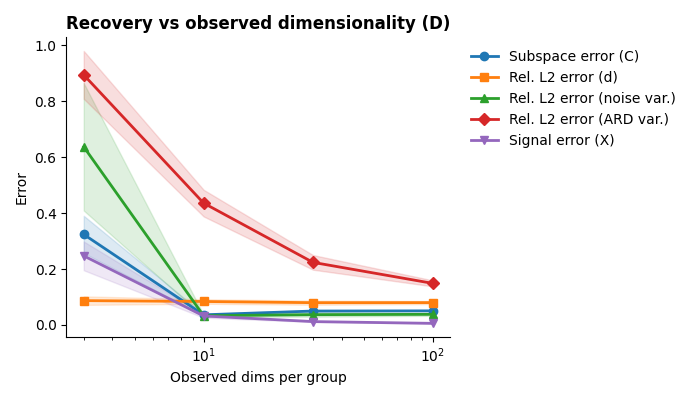
More observed dimensions per group provide more views of the underlying latent structure, improving recovery.
ARD variance improves monotonically with D — the complement of the N-sweep result. More dimensions per group means more loading entries informing each alpha, so D is the effective sample size for ARD estimation.
df_y_dim = load_recovery_sweep("y_dim_per_group")
plot_recovery_sweep(
    df_y_dim,
    title="Recovery vs observed dimensionality (D)",
    xlabel="Observed dims per group",
)
plt.show()
Recovery vs latent dimensionality#
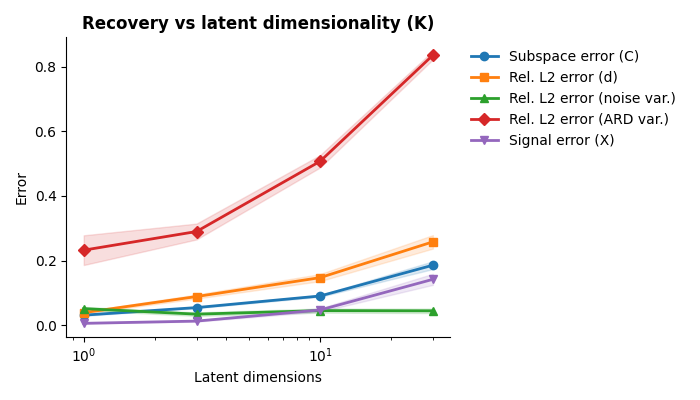
Higher latent dimensionality means greater complexity of the underlying signal and more parameters to estimate. Recovery difficulty generally increases with K.
df_x_dim = load_recovery_sweep("x_dim")
plot_recovery_sweep(
    df_x_dim,
    title="Recovery vs latent dimensionality (K)",
    xlabel="Latent dimensions",
)
plt.show()
Recovery vs number of groups#
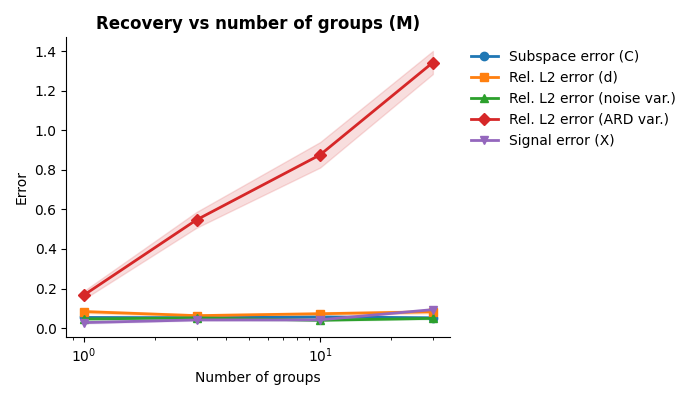
This sweep holds total D = 30 constant while varying the number of groups. All but the ARD metrics stay largely flat — total D is constant, so the information about the latent structure is unchanged.
ARD error increases sharply because the number of alpha parameters grows as M x K while the per-group dimensionality (D/M) that informs each parameter shrinks. At M = 30, each group has D/M = 1 observed dimension, making the ARD parameters difficult to estimate.
df_n_groups = load_recovery_sweep("n_groups")
plot_recovery_sweep(
    df_n_groups,
    title="Recovery vs number of groups (M)",
    xlabel="Number of groups",
)
plt.show()
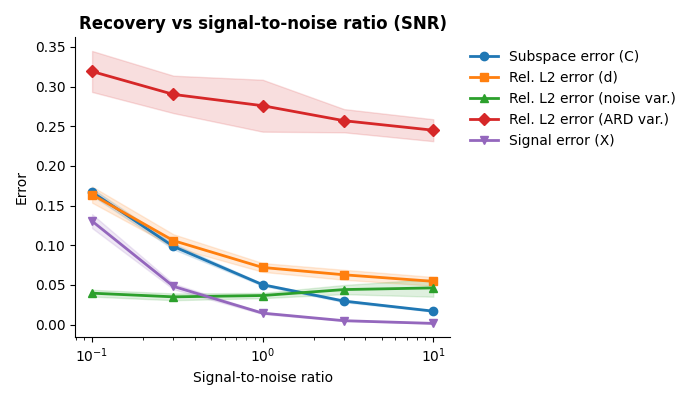
Recovery vs signal-to-noise ratio#
Higher SNR makes parameters easier to estimate. This sweep holds the signal structure fixed and varies only the noise level.
ARD variance shows modest improvement with SNR but does not vanish. As with the N sweep, the bottleneck is D/K, not signal quality.
df_snr = load_recovery_sweep("snr")
plot_recovery_sweep(
    df_snr,
    title="Recovery vs signal-to-noise ratio (SNR)",
    xlabel="Signal-to-noise ratio",
)
plt.show()
Total running time of the script: (0 minutes 0.691 seconds)